
The 2022 Atlantic Hurricane Season has been relatively quiet, especially since we're expecting above-average tropical activity this season. After a period of no tropical activity, the arrival of Invest 97-L this past weekend signaled that the Atlantic is waking up. It's worth a mention that we're currently one month away from the peak of hurricane season.
Invest 97-L's chances of development have fallen over the past day, making it unlikely to become a named storm and get a forecast cone.


Forecast cones are synonymous with hurricane season. You know what they look like, but do you know how to actually look at them?
A forecast cone shows the probable track of the center of a tropical cyclone. Since the size of the storm isn't considered, impacts may extend beyond the cone. These impacts can include strong winds, heavy rain, storm surge, flooding, tornadoes - basically what you find between the eyewall out to the rain bands.

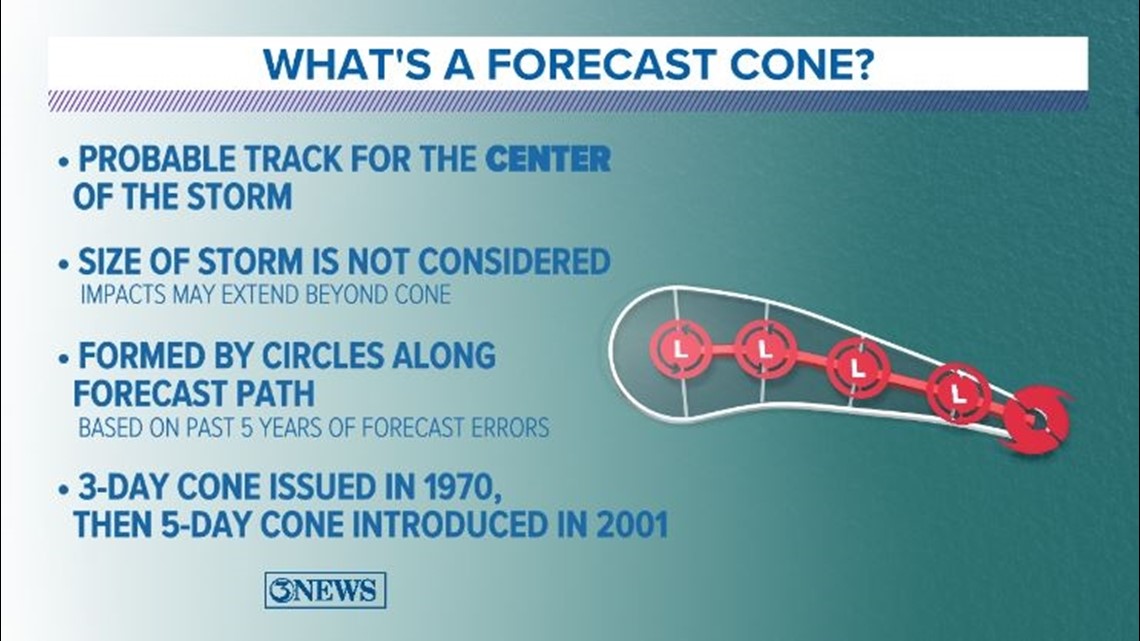
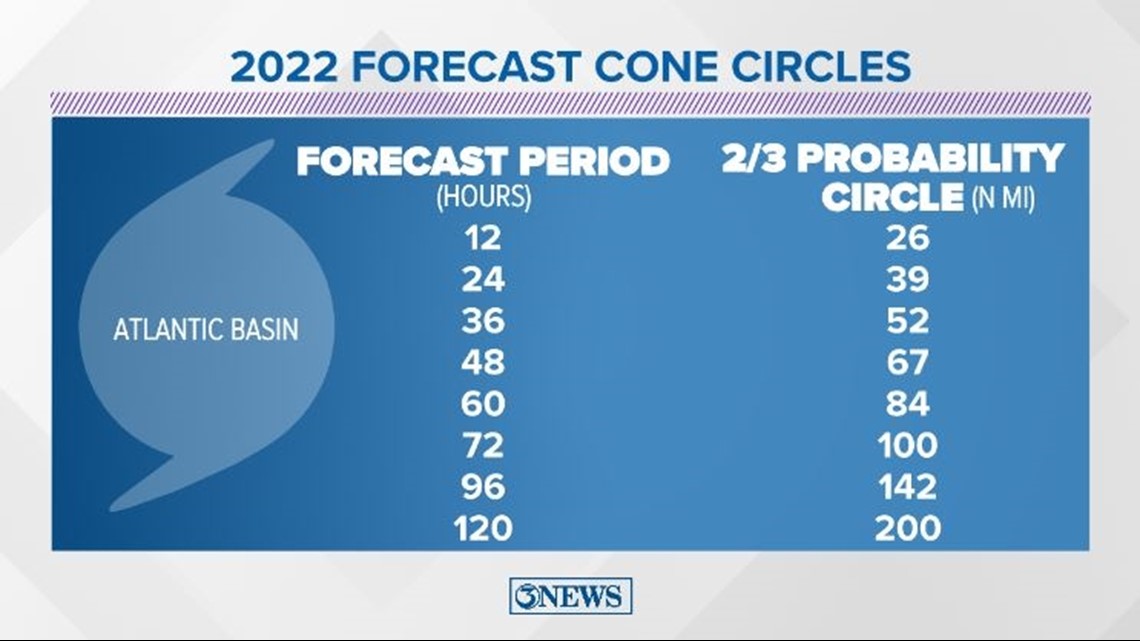
Forecast cones are created by circles placed along the forecast track. These circles are based on the past five years of forecast errors. The size of each circle is so that two-thirds of those forecast errors fall within the circle. Longer-range forecasts have a higher error, which is why the forecast cone probability circles - and consequently, the forecast cone - get larger farther away from the storm.
Three days out, the NHC error (probability circle) is 100 miles. This means that the forecast cone at 72 hours out is 100 miles across. At five days, the error is 200 miles.

The first forecast cones were issued in 1970, and they only went out for three days. Over 30 years later, they were expanded to include days four and five.
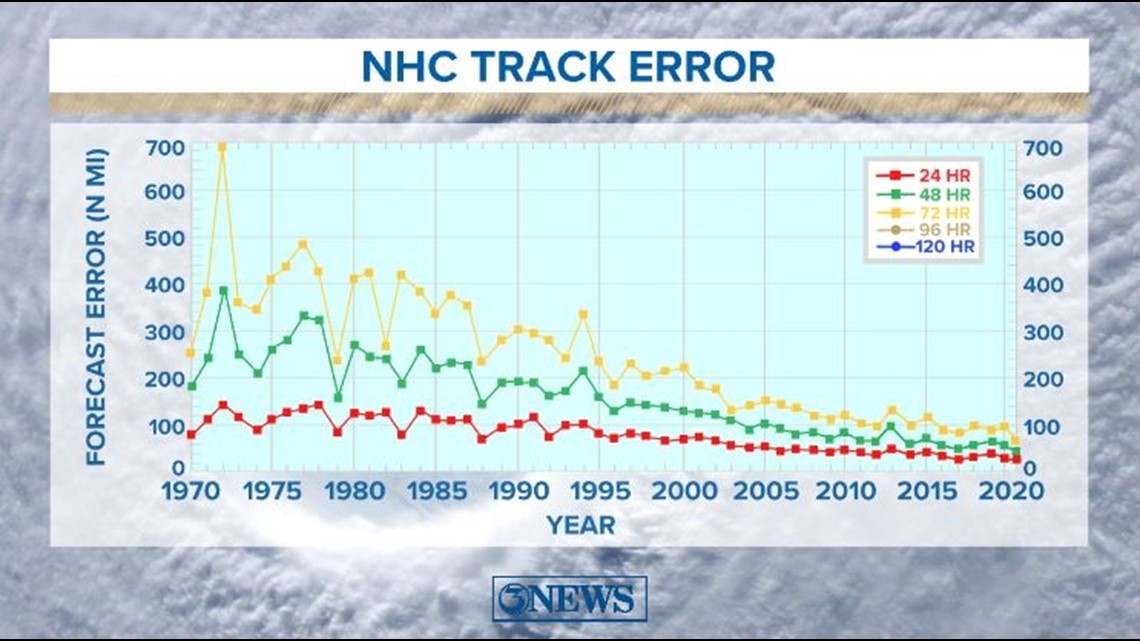
Forecast cones have significantly improved over time - and not only because of the timeframe expansion. In the 1970s, the average track error three days out was about 375 miles. For the last two years, the average track error for the same time frame has decreased to 75 miles.

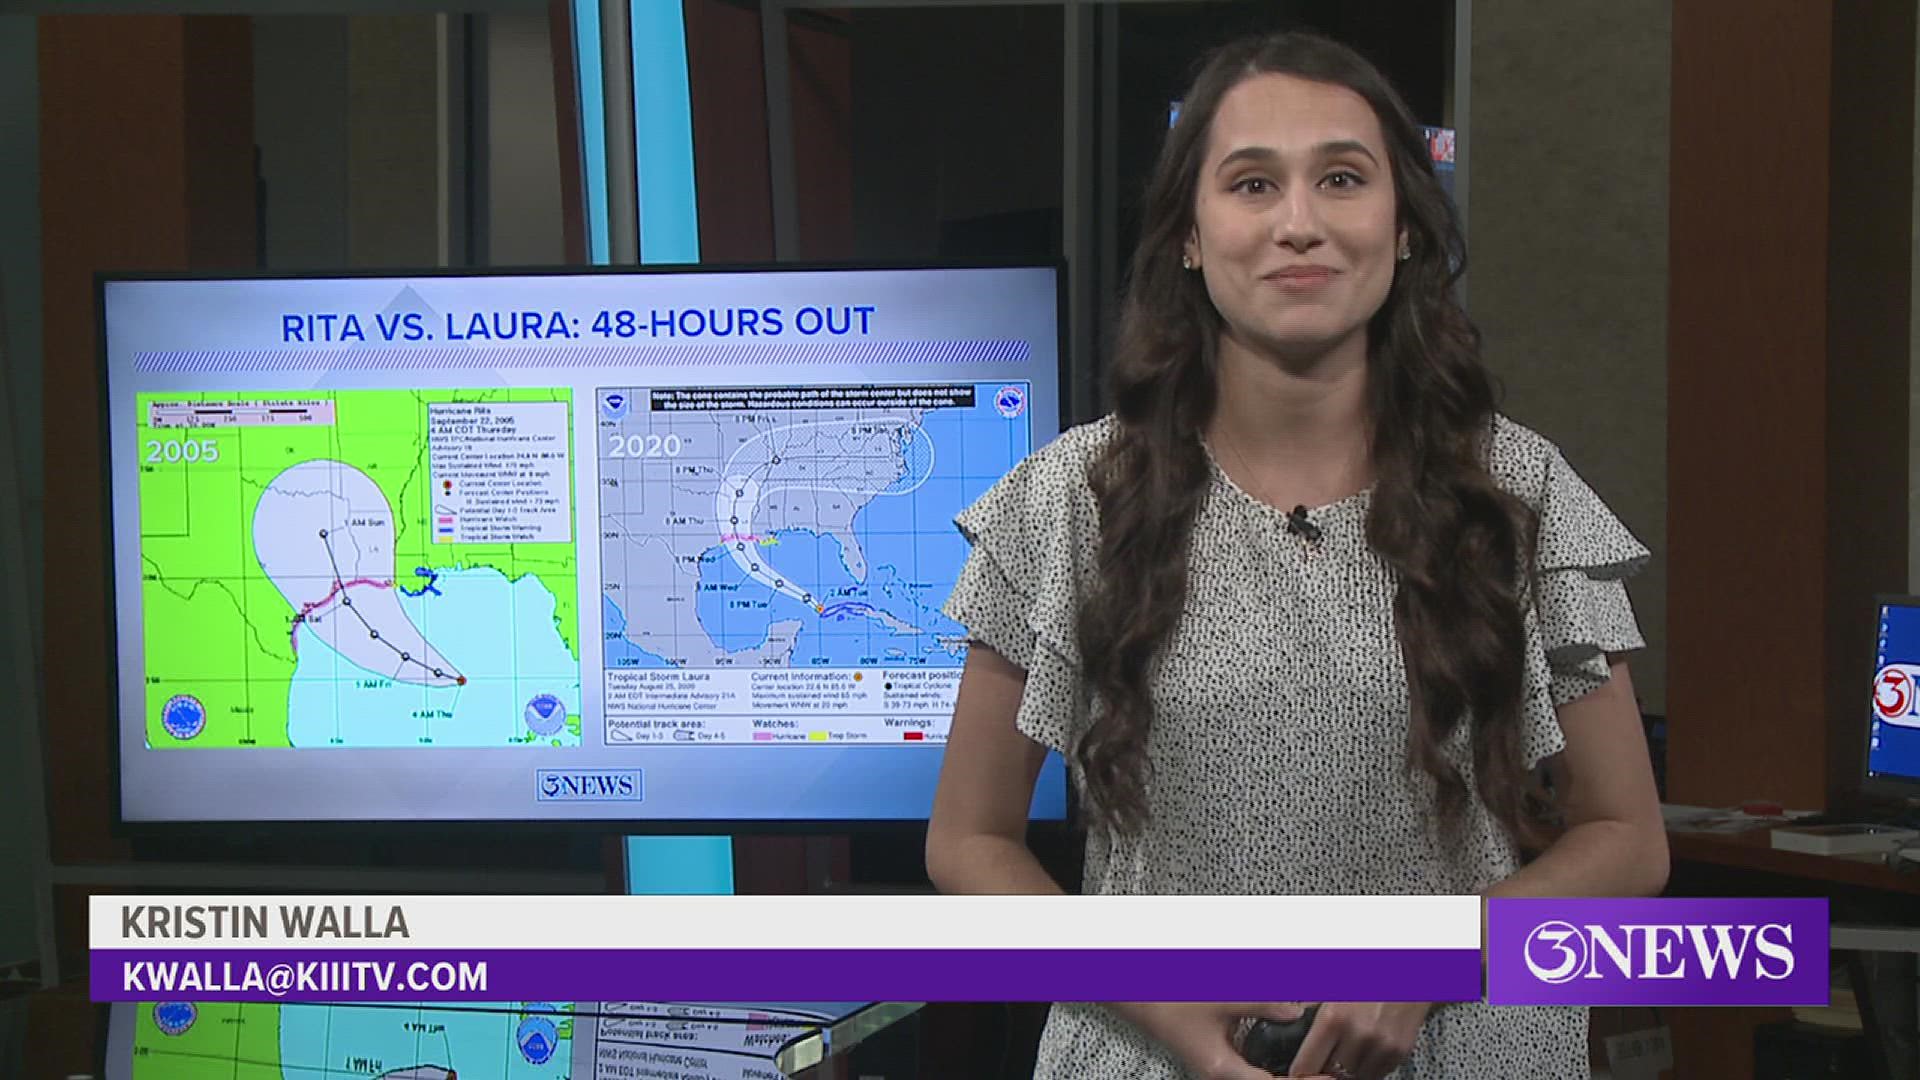
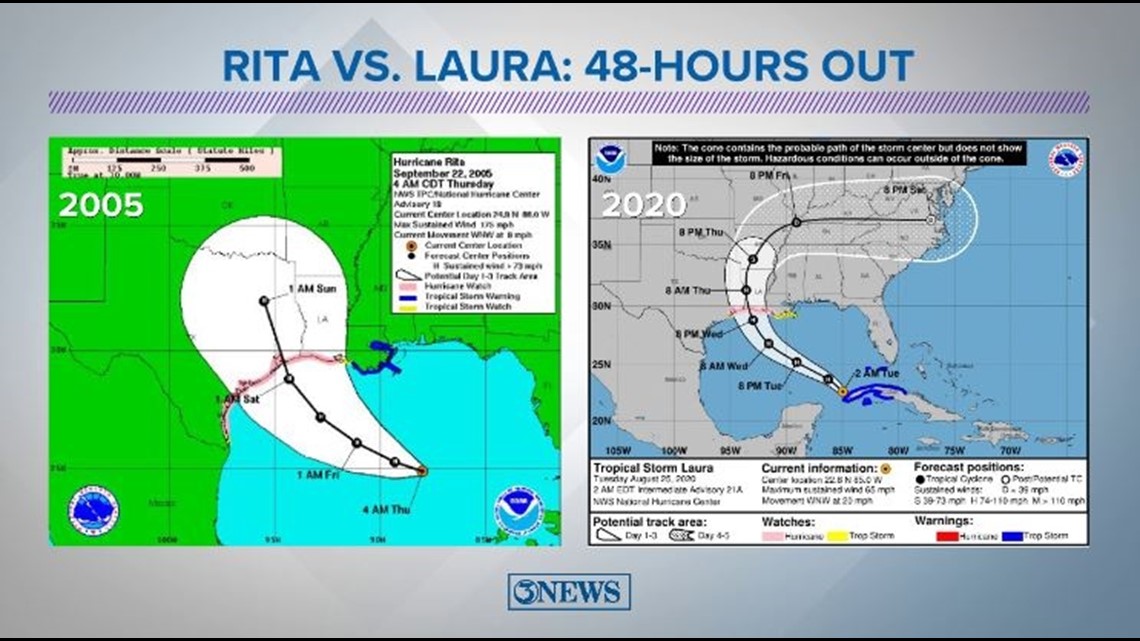
Here's a better visualization: Let's compare Hurricanes Rita (2005) and Laura (2020). Both made landfall in western Louisiana. This is what their forecast cones looked like 48 hours before landfall. You can see how much the forecasting has improved in just the last 15 years, as shown by the narrower cone for Laura.

These improvements are all thanks to advancements in technology and weather observations. And, they'll only get better with time - keeping us safer in the process.
Thanks & Gig 'Em.